In one of the previous articles we have introduced the Hammer and Hanging Man candlestick patterns. Today we will continue to talk about the reversal patterns (reversal patterns usually indicate that a trend reversal is taking place) that may end with a continuation of the existing trend or with its reversal in opposite direction) introducing the Doji Line.
What is a Doji?
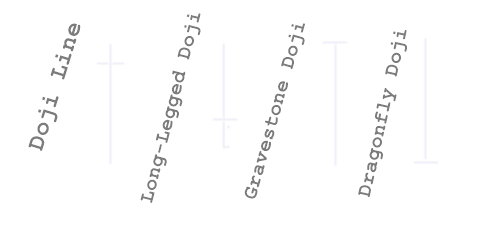
The Doji is a candlestick where the opening and closing prices are the same (or almost the same). It can take many forms, as shown below, depending on what the trading activity was in that period: Long-legged Doji, Dragonfly Doji or Gravestone Doji. When a Doji is part of a pattern (such as Doji Star or Morning Doji Star) it becomes particularly relevant.
A Doji candlestick means that neither the bears nor the bulls have gained control, and that the price has ended where it began. It’s a sign of indecision in the market, and could (in conjunction with other indicators) signal a change in market direction.
A Doji line can be easily detected because the opening price equals the closing price, thus this candlestick doesn’t have a real body.
How to apply Doji candlesticks?
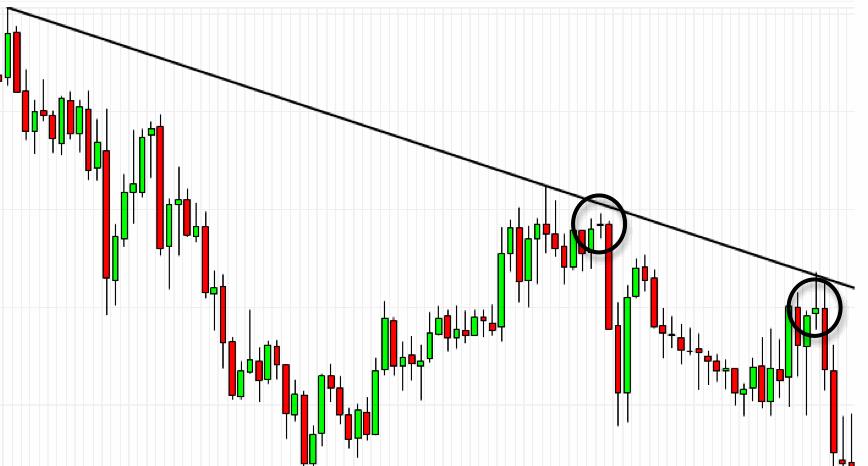
A good trick is to look out for a doji near the edge of a price channel (i.e., if a doji appears at the top of a channel it could indicate a bearish correction.)

There several types of Doji:

1 – Long Legged Doji:
- also known as Rickshaw Man, have long upper and lower shadows that are almost equal in length. These doji reflect a great amount of indecision in the market. Long-legged doji indicate that prices traded well above and below the session’s opening level, but closed virtually even with the open.
2 – Dragonfly Doji
- form when the open, high and close are equal and the low creates a long lower shadow. The resulting candlestick looks like a “T” with a long lower shadow and no upper shadow. Dragonfly Doji indicate that sellers dominated trading and drove prices lower during the session. By the end of the session, buyers resurfaced and pushed prices back to the opening level and the session high.
The reversal implications of a Dragonfly Doji depend on previous price action and future confirmation. The long lower shadow provides evidence of buying pressure, but the low indicates that plenty of sellers still loom. After a long downtrend, a Dragonfly Doji could signal a potential bullish reversal. After a long uptrend, long white candlestick or at resistance, the long lower shadow could be the sign of a potential bearish reversal or top. Bearish or bullish confirmation is required for both situations.
3 – Gravestone Doji
- form when the open, low and close are equal and the high creates a long upper shadow. The resulting candlestick looks like an upside down “T” with a long upper shadow and no lower shadow. Gravestone Doji indicate that buyers dominated trading and drove prices higher during the session. However, by the end of the session, sellers resurfaced and pushed prices back to the opening level and the session low.
As with the Dragonfly Doji and other candlesticks, the reversal implications of a Gravestone Doji depend on previous price action and future confirmation. Even though the long upper shadow indicates a failed rally, the intraday high provides evidence of some buying pressure. After a long downtrend, a Gravestone Doji could mean buying pressure and a potential bullish reversal. After a long uptrend, a Gravestone Doji could be the sign of a potential bearish reversal. Bearish or bullish confirmation is required for both situations.
To be continued…
If you find this article useful, please comment below and share it so other people can benefit from it as well!

