In our previous posts dedicated to candlestick charting we talked about the Hammer, Hanging Man and Doji patterns. Today we will continue the series about reversal patterns (reversal patterns usually indicate that a trend reversal is taking place) and introduce the Engulfing Pattern, also called Engulfing Line and which can be either Bearish or Bullish.
What is the Engulfing Pattern?
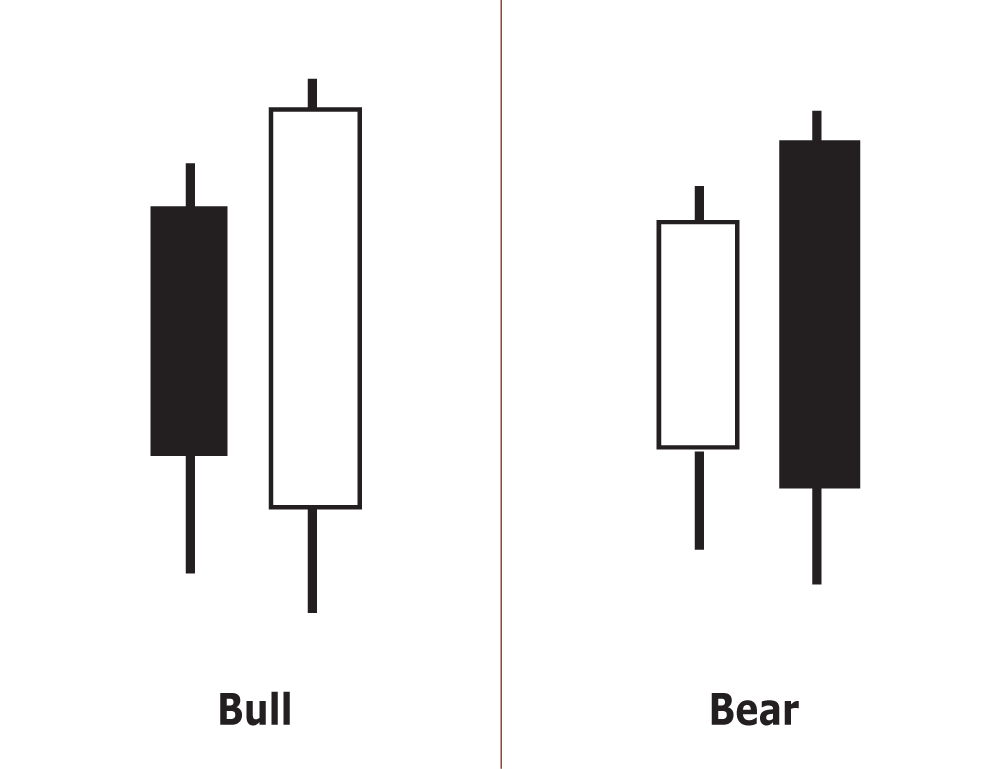
The Engulfing Pattern of Engulfing Line is very simple and easy to identify. An engulfing pattern signals a reversal, and can be bullish or bearish. It comprises two candles. The body of the second must engulf the body of the first, and must be the opposite colour to the first.
Bullish Engulfing Pattern:
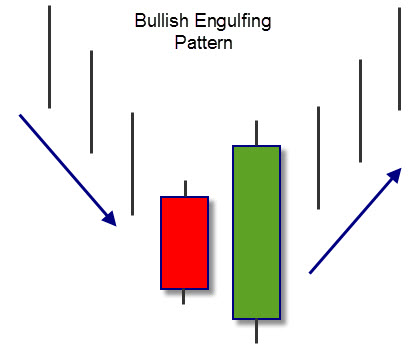
The Bullish Engulfing Pattern signals an uptrend.
In this case, after a downtrend, we have one first black (or red) candle-line followed by the second white (or green) candlestick, the body of which is greater in size that the previous candle.
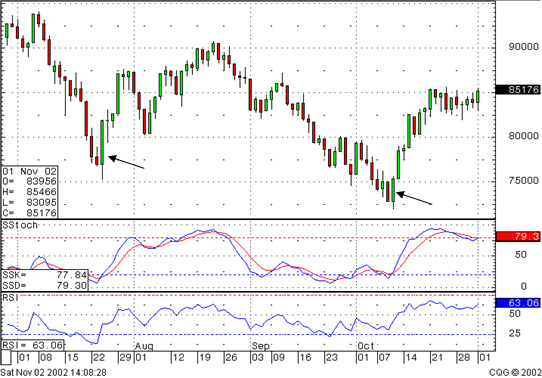
Note in the Dow Jones industrial chart that the whole market sentiment reversed at the Bullish Engulfing formations. The signals work equally well when analyzing indexes as they do for individual stocks, commodities, futures or any other trading entity.
Bearish Engulfing Pattern
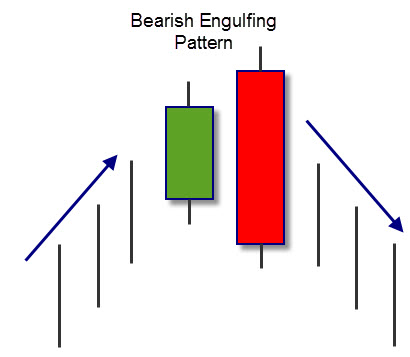
The Bearish Engulfing pattern is the exact opposite of the Bullish Engulfing pattern.
The Bearish Engulfing Pattern signals a downtrend.
In this case, the first candlestick is smaller and white (or green), with the real body contained in the second black (or red) one originated by an uptrend.
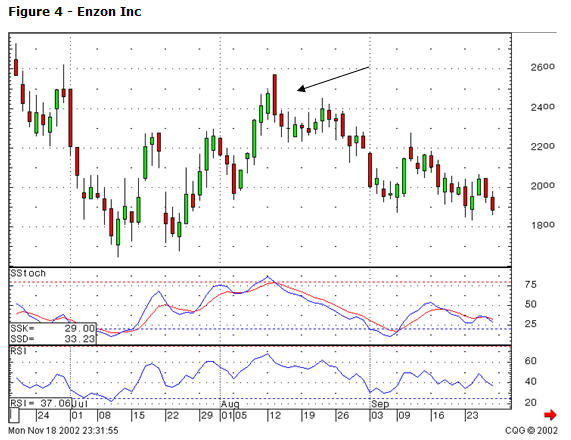
Note how the Bearish engulfing pattern terminates the uptrend in the Enzon Inc. chart. As the trend persists, buyers finally get so exuberant, they gap the price up. It immediately starts losing ground until it finally closes lower than where it opened the previous day. This clearly illustrates that the sellers have gained strength. That confirmation of selling starts a trend of selling.
An Engulfing Pattern must have these THREE FEATURES, in order to be easily identified:
- The market must be in a well-defined uptrend or in downtrend.
- Two candlesticks must form an engulfing pattern and the real body of the first candlestick must be engulfed by the real body of the second one.
- The second real body must be of the opposite colour of the first one (except when the first candlestick is a doji, which means it doesn’t have a real body). In case of the bullish engulfing, the first real body must be black (or red) and the second real body must be white (or green). In case of the bearish engulfing it’s the opposite.
There are some signs that may increase the probability of the engulfing pattern signalling an inversion.
These signs are:
- When the first candle-line is a spinning line and the second candlestick is a long line;
- When there is a high negotiation volume in the second engulfing candle-line;
- When the inversion signal is confirmed in the next session (by a gap or a long either black (red) or white (green) candle-line).

In this example of a bearish engulfing pattern, we have a clear uptrend, where the final candle has a red body, which engulfs the body of the previous candle. This suggests that strong selling pressure has come into the market, and could indicate a reversal or period of stagnation.
To be continued…
If you find this article useful, please comment below and share it so other people can benefit from it as well!
